RStudio + Shiny + Plumber + Docker
Intro
This one is very exciting for me.
So say you want to create a very complex application, that does several things. You can of course use functions, maybe in different R scripts that you can source. That way, if you work on a specific part of the complex application, you edit one of the source files, and one of its functions. In doing so, you can maybe separate the reading of the input data, from the cleaning, the plotting and the application of ML algorithms (for example).
That’s good. BUT: When you run all these scripts, they will run in memory, and be interpreted line-by-line, in a single CPU core. That’s a limitation of R (or so I believe).
Enters Docker
Docker allows us to run “independent applications” in containers. I’ve already installed it on the Home Lab server, but for now, I’ll work locally from the Laptop (Mac Book Air, with Docker Desktop). I can then move part of the containers to the server (or maybe, all of them!).
I will not go into the details of how Docker works here. Let’s just say it’s a reasonably lightweight way of running different applications in different “containers”. (Some readers might remember that I use a Container already to do all my programming exercises in RStudio).
Now each container can be brought “up” from a Dockerfile. The Dockerfile contains configuration information to bring up an application, with all its required libraries. Using a Dockerfile, you’re actually using the “Infrastructure as Code” (IaC) concept, whereby you bring up a running environment for an application by following a deployment guide made up of a few lines of code.
(You could do this with full VMs, but that’s not as efficient, and somehow I came to prefer Docker, which is why I got rid of the Oracle VirtualBox on my Mac – although it does work just fine and served me well for years in the past. That needed to be said.)
Why even bother with Containers?
Let’s say you have a complex application with several components. If you run all the containers on the same machine, well, you don’t get all the advantages (and that’s what I get if I run all the containers on my “home lab” server). Actually, the overhead of running components in different containers instead of all directly in one big application will not help speed things up (again, with R, you’d get the advantage of using different CPU cores for different containers instead of just one, so that might be a use-case nevertheless…)
But if you run different containers on different machines, and provided your code is conceived with this possibility in mind, you could in theory run different functions on MANY different machines. What you’d get then is a distributed application, a complex one made of components that are run on several machines. Each machine, depending on your needs, could run small components of your application, and hopefully each machine could be reasonably cheap. You could then work on the different components separately. If one of the machine dies for any reason, you could either run the now-missing containers on a different machine, or repair/replace the (reasonably cheap) machine and have it run quickly your missing containers.
You can even think about load-balancing the components, now called “microservices”, thereby ensuring your application can grow horizontally as needed, and keep working if any one such microservice goes down.
Food for thought, I’d say. No more one big application on one very expensive server, with eventual clustering solution, but rather many cheap machines entering and leaving the load-balancing as needed, allowing you to test each component in different versions (provided you have a DEV environment running your distributed application separated from a Production environment running a different instance). You have now stepped a bit into the world of devops and CI/CD. Welcome!
(Better even, you might like to know that Amazon Web Services (AWS) is well suited to help us do just this kind of things.)
Note: Don’t you think I know what I’m talking about, I have just started getting my head around these concepts…
Long Term Objective: A distributed, R-based, simple “SIEM”
I’m pointing to one of my personal goals for my Home Lab here. Not too ambitious, but it will require some efforts and some thinking nevertheless. A SIEM can be seen one such a “big application” that would warrant some efforts into distributing it into smaller, horizontally scalable components.
Before going any further: This is quite possibly NOT a great idea. After all, R is not thought to be the most efficient programming language out there. We have seen here how we can make it more efficient by executing different versions of the same functionality. We have even tested replicating some functions in C, for speed. It worked. But it would still run within one process.
However the idea is not uninteresting either. If I manage to break the components of a usable, basic SIEM, into sub-components and ensure that each component is accessible to the others through some sort of API, then I can now have a SIEM distributed in several containers, working together. And it will give me content to demo R programming, which is good.
Armed with a few physical machines, I could then in theory scale the different components “as needed”.
A “Security Information & Events Management” (SIEM) is a product/platform that gathers security data in one place for a Security Analyst to review.
So let’s see what a very simple SIEM would have to be capable of doing:
- It gathers logs (and maybe Netflows and/or packets)
- It parses the received information to make it “usable” for later analysis.
- It stores the information for future access (which requires maintenance)
- It provides an interface to look into the logs
- The interface in turn can present logs as-is
- Or offers some visualisation(s):
- Timelines
- Maps
- Network Graphs
- …
- And more recent SIEMs allow you to do some Machine Learning to look for anomalies (see the example for detecting Ransomware presented a few weeks ago <here> & <here>), correlations, possibly do some predictions of some sort… This I will look into a bit later on.
In creating the list above, I have already identified “components” for my “SIEM”. A very simple one, mind you: Long term retention, “historification” of the data for faster/slower storage use, etc. Those are needed functionalities that my approach will not cover.
Some of the above won’t be done in R. Particularly, gathering the information (e.g. logs) is probably easier done using a native Linux application such as SyslogNG. Or maybe I could be more modern about it, and set up an ELK platform. ELK is available in Docker containers. I could, at the very least, use Elastic and Logstash. The Kibana part, I might want to skip and instead create a Shiny App for my SIEM Dashboard.
So that’s already one or two potential containers: A SyslogNG, or an Elastic and a Logstash containers. I’ll see to it that I get there with my “Home Lab” server, but ELK requires quite a bit of RAM, and my miniPC has limited processing power… (so I’ll probably start with a SyslogNG container).
If I go the way of the SyslogNG container, I might want to save/store past data, pre-formatted to my needs. Maybe a SQLite container could help (lots of work then, as parsing logs is a good part of what you pay for when you acquire a SIEM – but my home setup is rather simple, so maybe I’ll manage, we’ll see).
For the presentation layer of my SIEM, I’d go for a Shiny App. I already use a Docker container to run RStudio, so that’s somewhat covered.
But instead of creating a very big and complex Script, let’s think about it for a second: Why would I have my container running the Shiny App do all the heavy lifting? Instead, I could in theory have a separate container to create maps, for example. Or yet another container to summarise IP data (running Rwhois for example).
When thinking this way, one can go further: Why have one container for all the logs? Why not instead have one container to work with the DNS logs and another one work with the Firewall logs? Sure, “correlation”, you might say. But bear in mind that my SIEM is not expected to be great (or to be sold, for that matter). I also really have doubts about whether R would be best suited to create a commercial SIEM, as mentioned earlier (in spite of my absolute focus on R as a programming language, C, Python, Java… Those are more general purpose programming languages that would probably be better suited. Or, if the focus is still on data analysis, maybe Julia).
Yes, a SIEM is essentially a Data Analysis platform, so it’s not completely crazy to consider R for it, but a production platform requires efficiency, and having hundreds of containers running on lots of cheap machines might prove hard to maintain. At least, as long as I am “just playing” in my spare time 🙂
To the point: rplumber.io
Let’s first test the possibility of creating a distributed R application. We’ll see from there in later posts.
For now, I’ll just test the “plumber” R package to see if I can leverage it. I found that particular package looking for a way to connect different R scripts, specifically for the goals presented in this post. I do recommend you look into the above reference to understand how Plumber works.
So I already have one container with my RStudio development environment. In a future version, I will have to look into Shiny Server, to abstract the user (me) from launching the Shiny App with my “SIEM Dashboard”.
So I follow the steps for Docker containers creation for a new “plumber” app:
https://www.rplumber.io/articles/hosting.html
And so I do:
docker pull rstudio/plumber
I run it interactively, and go looking for example applications.
docker run -it --rm --entrypoint /bin/bash rstudio/plumber
I copy the contents of one of the sample plumber.R code onto my local machine (Mac, not within a container) first. I copy it from:
/usr/local/lib/R/site-library/plumber/plumber/01-append/plumber.R
Then I create a new container with this example app. To do that, for now I simply run this:
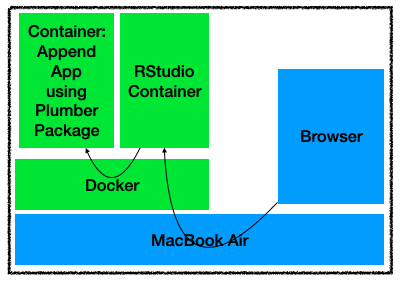
docker run --rm -p 1234:8000 -v `pwd`/plumber.R:/plumber.R rstudio/plumber /plumber.R
That’s just following the steps described on the Web page. It’s pretty straight-forward. I choose this app because it allows me to push some data to it (simply append a number to a list), and gather the resulting graph as a PNG file.
Then I test it. Because I need to “POST” contents, I’ll append some numbers from a new R script.
First I need to gather the IP of the container. By default, Docker will give it a name (which I haven’t chosen):
docker container ls
The container I just created has taken the name “unruffled_shamir”
Then I look for that name in the “bridge” network configuration:
docker network inspect bridge
(…)
"Name": "unruffled_shamir",
                "EndpointID": "019f8e99c1277b08a8ce77f4a207c6f6b13cd72402c707a642ba91ada404040f",
                "MacAddress": "02:42:ac:11:00:04",
                "IPv4Address": "172.17.0.4/16",
Now from a new R script I then try to append a few values to the container list using R code similar to the following (I connect to the port 8000, as I am effectively connecting from one Docker container running the following code to the other container running the “append” app):
library(httr)
POST("http://172.17.0.4:8000/append", body = '{"val":11}', encode = "raw")
I can check it works, from a new browser tab, by going to: http://localhost:1234/graph
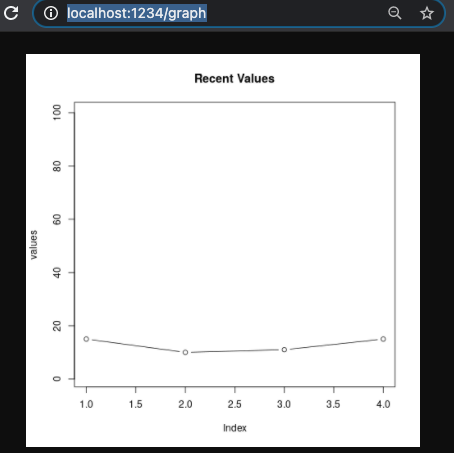
OK, good. I can now push values from a script, to a list of numbers through a script running in another container, using web queries, and then gather for example a plot showing those values.
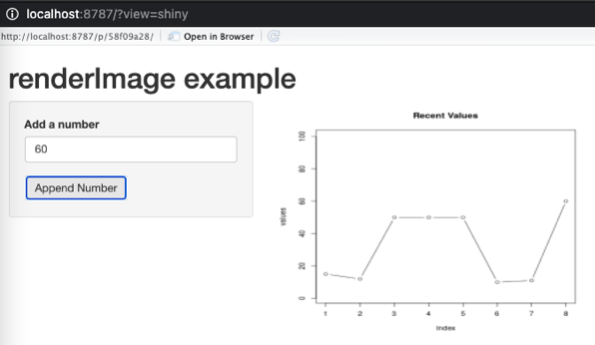
Let’s make this into a Shiny App:
# Second version:
library(curl)
library(httr)
library(shiny)

# Pre-load the graph with the current list of numbers:
download.file("http://172.17.0.4:8000/graph", destfile="tmp.png")

# Modifying a template from Shiny found here:
#   https://shiny.rstudio.com/articles/images.html
ui <- pageWithSidebar(
  headerPanel("renderImage example"),
  sidebarPanel(
    textInput("val_append", "Add a number", value = "", width = NULL,
              placeholder = NULL),
    actionButton("button", "Append Number")
  ),
  mainPanel(
    # Use imageOutput to place the image on the page
    imageOutput("myImage")
  )
)
server <- function(input, output, session) {
  observeEvent(input$button, { # When the user adds a number to the list
    my_number <- input$val_append
    # Only call to append number if input is actually a number:
    if(!is.na(as.numeric(my_number))) {
      POST("http://172.17.0.4:8000/append", body = list(val = my_number), encode = "json")
    }
    # Download the PNG showing the list of numbers as stored by the app in our second container:
    download.file("http://172.17.0.4:8000/graph", destfile="tmp.png")
    # Then update the Shiny output for the graph:
    output$myImage <- renderImage({
      # Return a list containing the filename
      list(src = "tmp.png",
           contentType = 'image/png',
           width = 400,
           height = 300,
           alt = "This is alternate text")
    }, deleteFile = TRUE)
  })
  # For the first load of the pre-loaded image:
  output$myImage <- renderImage({
    # Return a list containing the filename
    list(src = "tmp.png",
         contentType = 'image/png',
         width = 400,
         height = 300,
         alt = "This is alternate text")
  }, deleteFile = TRUE)
}
shinyApp(ui, server)
You might observe that I connect to the “append” app container using port 8000, while from my Mac I use the port 1234. That’s because of the port mapping I used when launching the “append app” container:
docker run --rm -p 1234:8000 -v `pwd`/plumber.R:/plumber.R rstudio/plumber /plumber.R
This makes Docker map the port on my laptop from 8000 to 1234, but to any other Container (i.e. the one with RStudio), the append app is listening on the port 8000.
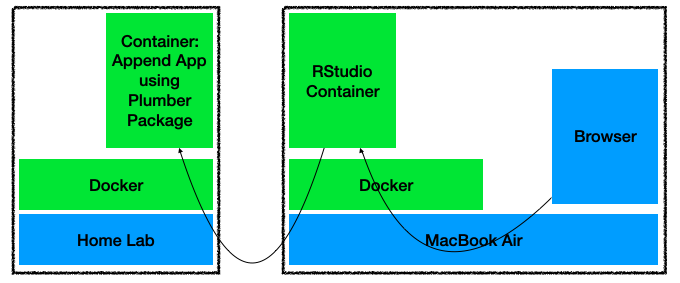
The resulting demo application, distributed across two containers, looks like so:
And that’s about it for today.
Conclusions
At least, it works. (And that’s one way of going about it). I now know I can run different R scripts in different containers, and then connect one another to run parts of a bigger application.
I also have tested moving one of the containers to my Home Lab server, thereby testing the possibility of distributing the processing load onto more than one machine. That validates the approach for a truly distributed R application across different machines and containers.
I’ll move on to using a different Docker Network to separate what is accessible from outside one machine, thereby limiting the exposition of each container to the rest of my network. (That will also help connect to other containers by name, which cannot be done using the default Docker bridge network.)
Anyway at this point, I could in theory already create an application that receives a list of IPs in a POST request, and returns a PNG map of the World, where IP addresses are mapped to their geolocation (for example).
I could then have one container to create the maps, calling a second container to read a log file to gather the relevant data, and a third container with a Shiny dashboard that calls the first one to refresh the map with the latest logs available with the push of a button. That might be another upcoming blog entry right there.