Intro
So as I keep working on an upcoming presentation I shall give in a few weeks, I thought I’d prepare something a bit more “live” than just a PPT with Memes (although who doesn’t like a few Memes in a PPT?).
My current idea is to talk about some “Machine Learning Key Concepts”, and then bring it back to Cybersecurity applications.
So part of it could be about two key things:
- Supervised vs Unsupervised Learning
- Symbolic vs Sub-Symbolic “AI”
Which I feel help frame a bit what we’re talking about when we talk about Machine Learning.
Today, we’ll do some review, and then talk about Clustering. Here an output of one such algorithm, in 3D:
Simplified definition of Machine Learning
Now I’m probably NOT the right source for you to learn this, so I really suggest you read about that somewhere else. The wiki puts it a bit like so:
“The study of statistical algorithms that can learn from data and generalize to unseen data, and thus perform tasks without explicit instructions.”
There are quite a FEW THINGS in that sentence right there. But for today:
- In traditional programming, a person WRITES A PROGRAM, that receives INPUT (say a picture), and generates an OUTPUT (say… “Dog” or “Cat”)
- In a Machine Learning approach, a person PROVIDES (LOTS OF) INPUTS AND CORRESPONDING OUTPUTS, and the COMPUTER CREATES THE PROGRAM (usually then called a “model”).
The above is specifically applicable to “Supervised” learning, but nevermind that, the key here is: The computer CREATES the MODEL that we (humans) can then apply to new data.
Why Unsupervised Learning?
In Cybersecurity, a relevant part of the job for ML can be about detecting anomalies.
Often times, you don’t get pre-trained neural networks applicable to your scenario. Or more simple: you don’t have access to relevant “big data” (which would help with training your models, indeed), i.e. people (companies) rarely share detailed data (network packets, logs, configurations, etc.) of their breaches. Understandable.
And so “unsupervised” learning might make sense in that scenario. Unsupervised Learning is about discovering structure in your data, that you might not have known about upfront.
Warning
Also there are lots of potential issues with leveraging ML, but two possibly relevant ones would be:
- Imbalance between classes (hopefully you have little data as examples of real attacks on your network, and a LOT of “normal traffic” data, for instance),
- Base-rate fallacy (a SOC analyst might, in certain settings, work most of their time on false-positives)
That said, let’s keep it simple for today, we will keep it clean, no complications (yet, anyway).
Symbolic vs Sub-symbolic
Simplifying A LOT, let’s just say for today that “Symbolic” can be read by a Human, and so it could look like sets of rules of the type:
IF (A & NOT B) THEN (ACTION X)
Where a person could read A (“number of Errors in 1′ log file > 100”), B (“less than 10 errors are of type ‘login failed’”), X (“Block originating IP on Firewall”). (Note the negation of B in the expression above ;))
Putting together many of these rules a person COULD setup a reactive security configuration for a firewall based on monitoring logs. I mean, conceptually, why not?! That would be an “Expert System”, as they called them in the 80’s.
Oh: And you COULD have “Machine Learning” on top of Rule-based systems. For example one interesting field (to me) that somehow has received little attention so far is that of the “Learning Classifier Systems” (LCS)… But that’s for another day.
When you enter the realm of Neural Networks, Dimensionality Reduction (say PCA on TF-IDF), BackPropagation, non-linearity, differentiable functions, etc., you quickly leave the realm of “human readable”, and you enter the world of vectors, matrices, tensors… In these settings, you use numbers, linear algebra, and the concept of distance.
For instance, distances between the “calculated class” and “real class” for a set of entries (say, images of cats and dogs, or log files, or…), trying to reduce these distances would mean trying to reduce the prediction error. Said like that, it is probably a bit confusing. But to be perfectly clear: That last sentence is a BIG part of what supervised machine learning with Neural Networks is all about! (More exactly in this case the goal is to minimize the difference between predicted and real class, or predicted and real value)
Let’s just make a note at this point, then: Sub-symbolic is the domain of neural networks, a world of algebra and calculus, weights and thresholds, which often are hard to translate into “human-readable rules”. And more specifically in the case of the current trend with deep neural networks (which are truly an impressive thing!), it’s a big issue, because there is a problem with how we can UNDERSTAND what the algorithm does. And that introduces things like lack of trust, issues with responsibility, and not being able to explain why something works (or, usually more to the point, why something suddenly DOES NOT work).
But the goal here and today is not to explain the details (“why backpropagation expects differentiable activation functions, for gradient descent, and the Chain Rule” – or “why ReLU works so good for training a NNet, but it’s not a differentiable function, and so people use approximations like leaky ReLU”… All that might be a bit much – Me at least, I still often need to come back to my books each time I want to explain these things correctly… So some other time :D).
Today I’ll focus on the concept of distance between points, and leverage that to identify “clusters” of points (and we’ll mention multi-dimensional spaces real quick).
Clustering
One type of “Unsupervised Learning” is what is called clustering. The main idea is to look at data and to try and create “groups of similar data points”. That’s it. That’s what Clustering is all about.
Right, but… How?
So let’s see:
If a = 20, b = 21, c = 99 and d = 100… Would you agree you could possibly say “a is nearer from b than from d”. And iterating, you might conclude:
- Group 1: a, b
- Group 2: c, d
Does that make sense? Hopefully YES 🙂

Let’s move on to two dimensions. You get a set of points (imagine, for Cybersecurity, I don’t know: for each point representing a machine on a network, the x coordinate represents the number of TCP Packets sent by the machine from its TCP Port 80 in the last minute, and the y coordinate represents the number of TCP Packets sent by the same machine from its port TCP 443 in the last minute).
So now you might have two sets of points that “cluster together”, some with very little activity on both axis, that is: (x, y) = 0, and others (maybe only a few), that have a range of numbers but overall have maybe lots of activity as per both axis, so say for example (x > 1000, y > 1000).
Let’s apply the same logic as above. There will probably be two clusters, one of which might have many points but overlapping, and the other a cloud of points on the top right… Representing Web Servers.
That’s probably a very dumb example, but it serves a purpose: You COULD identify groups of machines in these two dimensions. Distances here would probably use Euclidean Distance, but if you understand it visually, good enough for today.

And with more (very similar) dimensions, you might be able to discover groups of machines that are similar to one another, but a bit different from those of another group…
Here, I just gave you an algorithm to group machines and separate Windows from Linux, or Clients from Servers, or Web from Mail from LDAP from NTP from DNS servers… Obviously, the above categories are a bit… not great, well because most of the time you will KNOW what the machines are to begin with. But what if all you have to work from is a tcpdump file?
Let’s visualize this, shall we?
DBScan
One (of MANY) algorithms out there to do clustering is DBScan. Its very name says most of it: “Density based Spatial Clustering”.
I’m not going to reinvent the wheel today, and we’ll go right ahead and leverage the dbscan R package and its documentation. The code is here.
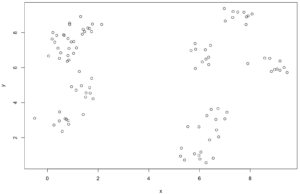
So first, we’ll generate a set of seemingly almost-random points in a 2-dimensional space.

Visually, a person can already tell there seems to be some structure in there, some groups. How many might be a bit of a judgement call, but still.
Leveraging a number of neighbours (say, 4 nearest points to identify a group) to identify an “elbow” of the separation of the groups, we can set a “noise threshold” to the above whereby if a node is too removed from a group, it could be considered as SEPARATE.
Let’s see:

In the above, there is a “clear” change in trend in the line that finds said distances, at 0.85 approximately (red line) that identifies regions of LOW DENSITY of points, that the DBScan algorithm would then propose as a limit to separate OUTLIERS from the rest of clustered points.
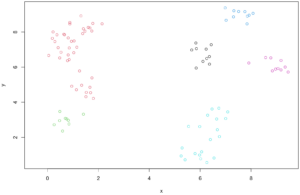
It’s a bit of a mess to write down, but hopefully the results are self explanatory:

Here we color the groups of points by cluster, or what the algorithm has proposed as such. Again, the only concept in use was the distance to other points. A detailed look in the last picture would show that maybe something is amiss, at least one point had x < 0 before, and it doesn’t show up here.
That’s an identified outlier.
***
Let’s take a minute here: We’ve identified stuff that goes together, so “clusters”.
But one key aspect (value) of DBScan over some alternative algorithms for clustering is, it can help with ANOMALY DETECTION. Indeed, that’s why I have chosen this algorithm today (the typical intro to clustering would have probably focused on KMeans first :D).
So now, we have an “automated ML algorithm” that receives coordinates of points, and is capable of identifying groups of points, AND points that seem to not quite fit anywhere.
Remember earlier when we mentioned “imbalance” of prevalence of “normal traffic” vs “attack traffic” on a corporate network? Well, this is why I mentioned it. With a little luck, what a DBScan output tells us are “outliers” is something that is UNUSUAL, and HOPEFULLY that’s actually identifying attack-related data for us!
OK, back to the demos.
Why bother?
OK, so beyond finding things out about your data, the data you have… What if you could get information from new data (of the same kind, that is)?
After all, you’ve identified groups. And that’s cool, and maybe you’ve learned that somehow ten computers seem to behave similarly, and quite differently from another set of 50 computers, on the same network. And maybe that leads you to do some digging and conclude that all 10 of the first group were DB servers, and the other were front-end stuff (Idk, Apache). All from network dump files. Not too bad.
But now you receive a new dump file, which you’re told contains network traces from other computers. Wouldn’t it be cool to then just feed that to your “trained” model (which, remember, was actually unsupervised to begin with), and get it to tell you – like a supervised algorithm would: That new machine is a “Group 1” machine (and so you can deduce it’s a DB server).
I know, I know. Just look at ports, and you would know, fair enough. Plus, it’s not clear the example above would even work (there are MANY considerations in there). Anyhow, let’s take your “pre-trained” model from above, and see what would happen with say 12 new points:
 That’s it: New data, and without you having to look at it, the machine will tell you to which group each entry belongs. That’s the cool thing about Machine Learning 🙂
Going 3D
An almost identical exercise, but in 3 Dimensions. I just want to show it so that we can all agree on one thing: We human can conceptualize up to three dimensions. But with this next visualization, I hope to show one important idea: There is nothing precluding an algorithm from going and work into “higher dimensions”. We can easily visualize groups in 1-D, 2-D, now 3-D (maybe, on a screen, with the help of some animation). But 4-D, or 1000-D, is NOT a problem for a computer!
OK, so in 3D, same algorithm, similarly random-generated data points. What DBScan can do is shown at the top of this Blog post 🙂
(I just know people are more impressed by 3-D animations than 2D visuals for some reason, and so I put it at the top to keep you interested :D)
It’s NOT magic
Let’s see a very classical example, and how DBScan kinda’ fails. Not really, but still.
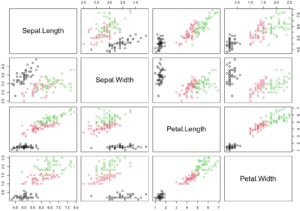
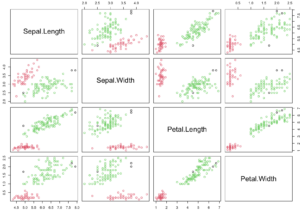
When applied to the “Iris” dataset (if you’ve ever studied a bit of data science, you know what it is), DBScan identifies two clusters, while we all know there are 3 types of flowers represented in the dataset.
That does NOT mean that DBScan FAILED. It just means that the information it can tell us about that dataset is that one group of flowers is clearly different from the rest. And that’s OK, although we know it’s insufficient. BUT YOU NEED TO KNOW IT’S NOT MAGIC. From a few data points / coordinates, it’s still only working with so much information…
Real groups: 3

DBScan (with selected parameters)groups: 2 (and a few outlier points)

Warning 2
NOT ALL numbers are ordinals/cardinals. Although 20, 21, 22, 23 might seem nearer from one another than say from 80, 123, or 443… That doesn’t mean you can use THAT “distance”.
In Cybersecurity (but in any other field), PLEASE remember DOMAIN KNOWLEDGE can “make or break” a data scientist. And not knowing why things don’t work as you expect then is a bad thing. And it’s not always the algorithm fault.
Web is different from NTP, while HTTPS uses cryptography and so does SSH, but… In context, port TCP 80 is NOT nearer TCP port 22 than it is from TCP Port 443.
You’ve been warned.
Conclusions
Unsupervised Machine Learning has potential for applications to Cybersecurity data. Maybe used on network traffic captures or logs, one can identify structure and propose groupings of machines, users (by their activity, accesses, hours, who knows…).
Although we’ve seen one algorithm and how to visualize its decisions with 2- and 3-dimensional data, the “sky is the limit”, and if one can come up with 100 (or 1000) such dimensions (that’s the concept behind “feature engineering”), there is nothing precluding our machines to work with that and propose groupings for us (although not all algorithms deal nicely with “curse of dimensionality”, but that’s a different topic). In ML, more (quality) data is often a good thing. Also, if one of the 100 dimensions helps us separate perfectly some groups, some ML algorithm will find that and use it for us. Would you visualize manually and study 100 dimensions? 1000?
And that’s where it’s powerful: A person might have a hard time grouping hundreds of machines or users while considering several aspects at once, much less when the number of groups or “kinds of groups” to be found are not known upfront… But that’d be no issue for a computer 🙂
Hopefully I can walk some of my colleagues through the above concepts (organised in a PPT) and show them (in R :P) how all the concepts “work”, and then translate into “real world applications”.
Maybe next week I’ll move on to making text into multi-dimensional data points. And then, we’d be set to apply all the above to text data. Which is quite prevalent in Cybersecurity (CVE descriptions, logs, code… it’s all text :D).
Resources
Wikipedia as linked above, and dbscan R Package documentation, mostly.
Also this about making a video from 3D scatter plot with RGL