Once again I will step away from purely “programming” concepts, but this is tangent to say the least. This entry is more about theory of Data Science and one particular aspect, that is the “Domain Knowledge”.
Speaking the right language
There are discussions out there in the Project Management field, for example, about whether or not a Project Manager needs to know about the concepts of the project itself: Say in IT, a project manager should have some knowledge of IT. Again, that is subject to discussion, as the “Management” part does not imply “technical knowledge” of any sort: Risks are risks, plans are plans, costs are costs, etc.
I usually disagree, because I believe you can only be better at managing something if you understand it well. Then again, that doesn’t mean a P.M. cannot work if she doesn’t understand perfectly every detail (as one probably can’t anyway).
Alright, back to the matter at hand:
There are arguments in the Data Science field about whether or not one needs to have a more or less comprehensive profile, covering Data Engineering, Programming, Math, Presentation and all other skills related to the broad “Data Science” concept.
But when it comes to applying Data Science, there is one thing I have an opinion about: One needs Domain Knowledge. Let me show that with two (purposefully obvious and stupid) examples.
The Airport Operator
I’ve had the opportunity, while I was working at a consulting company, to work with many types of projects, in many types of clients/companies, doing many types of works.
One such client, for a short while, was an airport operator. One of the things I learnt there is that an airport is actually pretty much like a small city (btw, I worked in a PMO, not on data science or programming). But it is also very much a business: It needs money to operate.
Now let’s suppose for a minute that an “airport business” depends for whatever reasons on the flights not being delayed too much. Why not, after all: If an airport was to be known for late flights, it would probably impact the volume of travellers to chose that airport, or prefer it over railways, or any number of alternatives, right? So this is not a crazy assumption.
Note: One would possibly think more about the airline when discussing delays, but maybe the airport plays a part there. Anyhow.
So you get a lot of flights delays data to analyze. What I want to get to is this:
The most obvious of details count: Maybe you need to know, before you start playing around with the data, how to recognise flight codes. Maybe you need to be very aware of weather/temperatures at some point of the analysis, and then you need to know the units in the data (ºF / ºC…).
But some stuff might be more subtle:
Maybe you need to understand the assignation of “fingers” (this is the thing “allowing passengers to board and disembark without going outside and being exposed to harsh weather”, instead of going down on the Tarmac, taking a bus, spending 20 more minutes waiting, and then getting on a plane under the rain…). As it turns out, airlines companies pay for accessing certain airport gates with these “fingers” instead of others (actually, as someone explained to me, they bid for it). And maybe that’s relevant to the distribution of delays by airlines!
In other words, I believe one needs to know how an airport works, at least up to a certain level of detail, before taking on projects of data analysis for an airport operator.
Context, anyhow, is important for data analysis.
The incorrect K-Means use
Let’s come back to IT and IT Security as our “domain”.
I will present now something completely wrong, but technically feasible. This example shows how the world of “Auto Machine Learning”, in spite of being a great concept in which I believe a lot, could be potentially dangerous, if not used correctly.
So say you want to cluster data in two groups (whatever the reason, that’s the thing about clustering vs classifying, in clustering, you don’t necessarily know why one cluster actually clusters the data… Anyway).
You don’t know much about Netflow (I’m sticking to that example one last time for a while, we’ll move to other datasets later, don’t worry). But they give you a file, not a big one, which you can ingest in R with a read.csv command, simply using the tabulation as a separator. So you do just that.
Then you end up with several column, and decide to play around.
Now for whatever reason, you decide to explore the data focusing on two columns, which you know are numeric in nature. AT THIS POINT, let’s assume you DON’T KNOW what that data is, you just know they are columns of numbers.
And so you take columns one and six, both numeric, and for whatever reason you choose to try and use K-Means and find two clusters, if that can be done.
Actually, you’re worried to be correct on the math, and you know K-Means uses (by default) the Euclidean Distance between two points in n-dimensions (2 dimensions here for the example). So you worry of the impact of different scales for the data (you shouldn’t actually), and you decide you should normalise both columns to make them more comparable. You “scale” them (thereby actually not achieving much).
What you DON’T realise, because you’re not familiar with IT Network data, and you haven’t actually plotted the data, is that the second column you use is actually about destination TCP/UDP Ports. Neither have you cared about the fact that the other column was actually a timestamp (in a unix date-time format).
And so you don’t realise that the Euclidean distance between “22 and 80” is not at all smaller than that between “22 and 3389”. (As it turns out, in concept, 22 is nearer from 3389 than from 80. 80 is for HTTP web servers, while 22 and 3389 both related to connecting to a remote OS, albeit two different kinds of OSes…)
Now suppose your K-Means algorithm, flawlessly and inevitably, ends up finding two clusters: one group of points that are nearer one another on the x-axis (22 and 80), and another group of points more to the right (say for example nearer to “port 443”).
library(lubridate)
library(ggplot2)

conns <- read.csv("/mnt/R/Demos/conn_extracts_log/second_sample.log", header = FALSE, sep = "\t")
# We keep two numeric columns:
conns <- conns[,c(1, 6)]

conns <- conns[conns$V6 <= 450,]

##
# Let's suppose we do not know the following:
conns$hour <- as.POSIXct(conns$V1, origin="1970-01-01")
conns <- conns[conns$hour > as.POSIXct("2012-03-16 12:42:00"),]
conns$port <- conns$V6
##

# Quite useless in this case:
conns[,1:2] <- scale(conns[,1:2])

# For the value of the demo:
set.seed(1235)
clusters <- kmeans(conns[,1:2], 2)
conns$cluster_k <- clusters$cluster
# What an "auto-ML", not domain-specifi would do:
clusters_plot1 <- ggplot(conns, aes(x = V6, y = V1))
clusters_plot1 <- clusters_plot1 + geom_point(aes(colour = factor(cluster_k)))
clusters_plot1
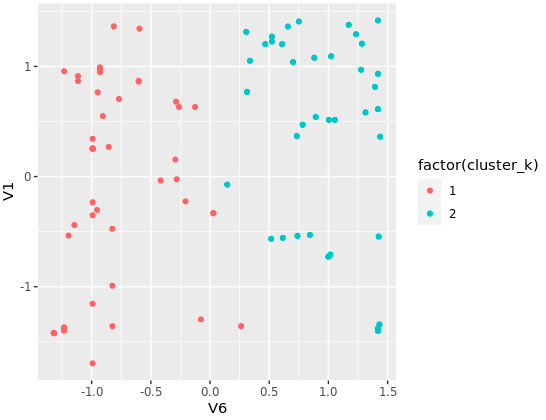
K-Means did find two clusters indeed.
# Clusters separated by distance where the X axis is a network Port, makes
# no actual sense:
clusters_plot2 <- ggplot(conns, aes(x = port, y = hour))
clusters_plot2 <- clusters_plot2 + geom_point(aes(colour = factor(cluster_k)))
clusters_plot2
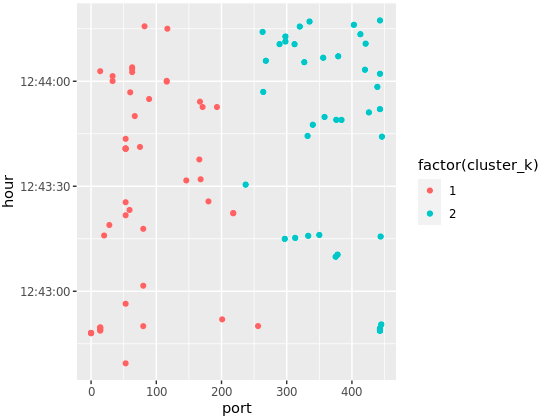
Clearly, TPC/UDP Ports cannot be used to measure distance between two points. Actually in the middle, you can see two points that are not separated horizontally, that is because K-Means has chosen centers in the diagonal, not the horizontal axis. That makes even less sense in context.
You’ve done nothing wrong in the programming, but because you didn’t understand the data, you ended up with completely incorrect results and/or did not understand the theory behind the K-Means algorithm.
Conclusions
The above is the reason behind me focusing on Data Science applied to IT Security: I’ve worked in that domain for the best part of the last 14 years or so, now.
That is not to say I couldn’t do a decent job analysing flight delays, or house pricing, or any number of other things, with the right data and sufficient time.
But I couldn’t do it for things that require knowledge I don’t have. So I wouldn’t really want the responsibility for analysing medical data, for example. The stakes are too high, and I could make mistakes, involuntarily, through wrong assumptions or incorrect understanding, in spite of going flawlessly about the algorithms and the math.
And I thought this idea warranted an entry here.