Generating “Company Networks”
Just as a starting point for my “Company Network Graph Generator”, I put together the first (far from great) igraph-based code to generate a 3-layer segmented Application, such that one Application can have a few front-end, a few back-end and a few database servers, like so:
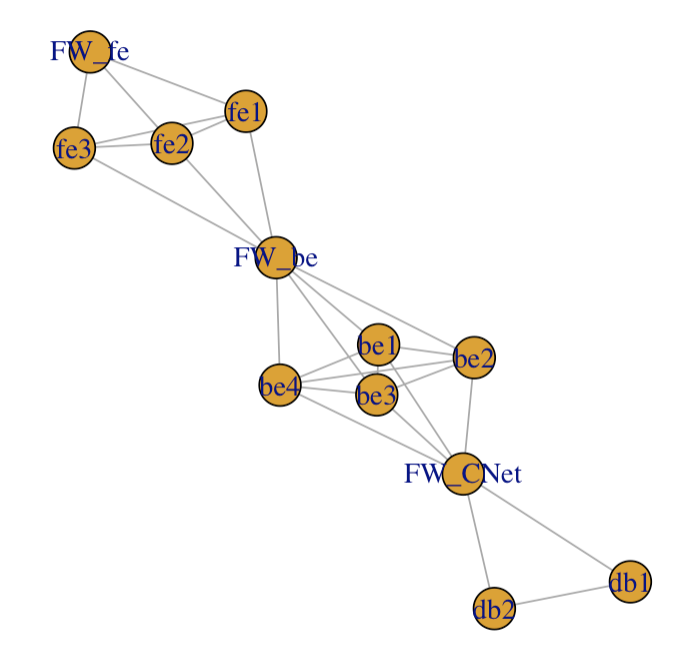
There was no secret, aside maybe from locating the right function to “merge” two sub-graphs, which I solved with igraph::disjoint_union() in the end.
So now I can generate each “layer” separately, then create the union, and then add the edges, which (for the relevant part) looks something like so:
t_g <- disjoint_union(t_g0, t_g1)
t_g <- disjoint_union(t_g, t_g2)
t_g <- add_edges(t_g, as.vector(
  rbind(
    grep("^fe", V(t_g)$label),
    which(V(t_g)$label == "FW_be"))))
t_g <- add_edges(t_g, as.vector(
  rbind(
    grep("^be", V(t_g)$label),
    which(V(t_g)$label == "FW_CNet"))))
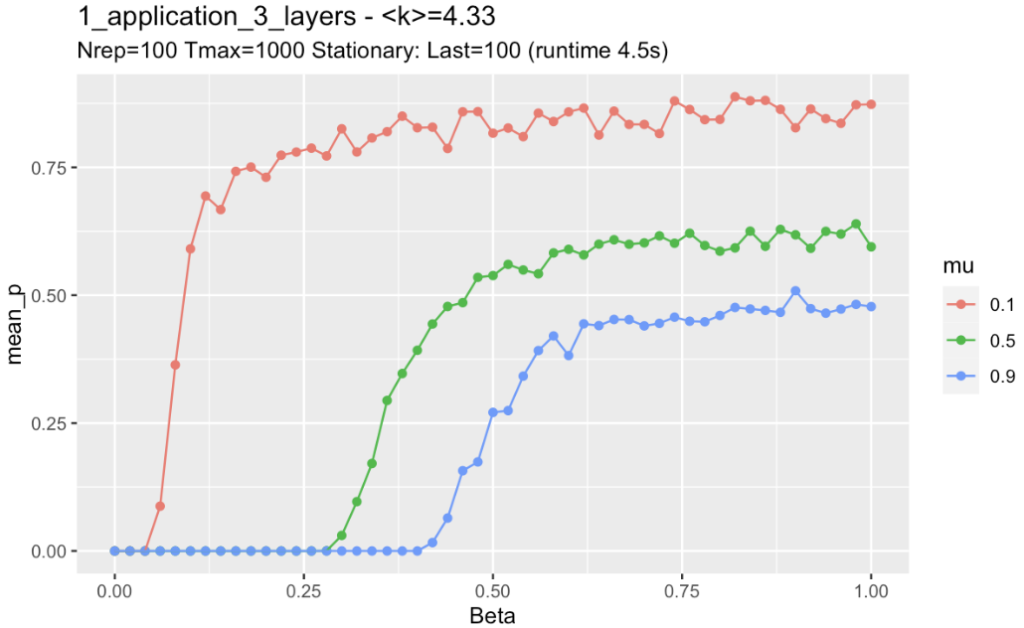
Simulating an infection on that basic network
And now I can run my SIS simulator on that, it should go rather fast… 20% of nodes initially infected, 100 simulations for averaging per config, 1000 time-steps per configuration, averaging results over the last 100 time-steps (“stationary phase” for prevalence of infection)… Anyhow, it works:
Next
I need to re-organise the whole thing, make the code more functional, etc., so that I can generate MUCH more complex networks.
But mostly because I need to add the varying parameters I was discussing yesterday.
We’ll see.
(Also, I might want to generate a “days since start date”, because I won’t be able to work on this every day, and I will fast loose track of how many days since October 11th have passed. Yes, I could do it in my head, though… I’ll see if it becomes a bother.)