Haven’t had much time yesterday, and I wanted to move forward right now as I am “starting” this, see if I can steer it in the right direction to begin with, and before I have new conversations on the whole concept with my Dissertation Tutor.
Alright, so I wanted to have “variable resistance” of different nodes.
A node in a SIS simulation is susceptible of infection with probability “Beta”, so its resistance would be inversely proportional to its Beta.
Now in my example 3-layer application, I have drawn “connection” nodes between each layer to be security nodes (namely “firewall”, but it’s just a name, it could be a WAF, a DBF, whatever security measures protecting a layer of machines from another layer…).
As a first approximation for the simulation, I could decide to set “high resistance to infection” on these so-called firewall nodes. That way, if a server node in one layer is infected, that infection have lower probability of reaching another layer.
That’s the general idea for today.
Verifying implementation
Well, to have an understanding of whether my implementation works, I take my 3 layer application graph, and simulate infection of 2 servers initially. I’m not yet looking at effects on the long run, and so I wanted to visually see whether the firewalls somehow actually reduce the possibility of transmitting an infection to another layer.
I therefore set a much lower Beta for my “firewalls” – much so also because such nodes are connected with all servers of either side, so they are exposed potentially to many infectious nodes.
Let’s have a look.
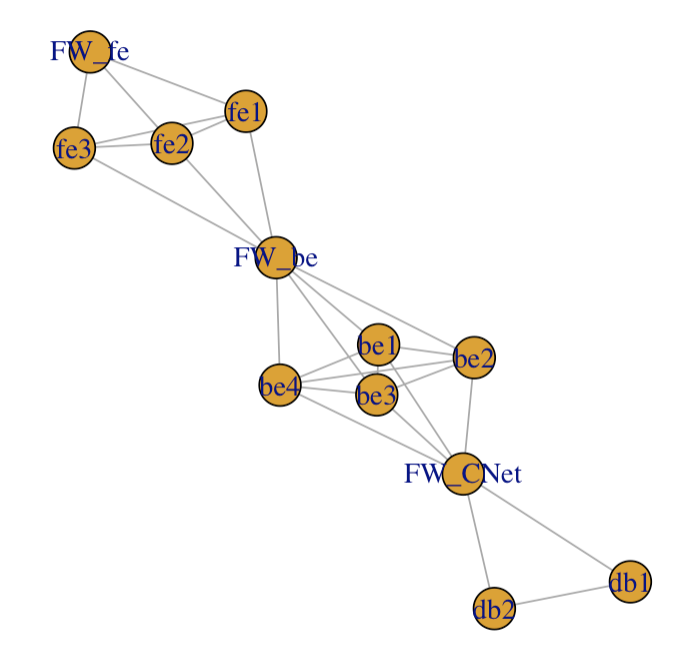
That was my base “application” network, with Front-End, Back-End and Database layer.
And that’s the application with initially one server infected in the Front-End and one in the Back-End layers. Only 25 time steps for now, just to “have a look”:
Conclusions for the day
We have an “infection” that’s rampant in a given layer (two out of three initially in fact), but our “firewalls” are reasonably effective (although not perfect) to avoid the infection to “jump” to another layer.
When a firewall is in fact “infected”, the next layer is exposed and then can get infected, but one can tell at the very beginning the Databases are somewhat protected from what happens “above”. Later, when the Databases are infected but the back-end servers are clean, the infection does not pass (not in the window of time used for the video, that is) back onto them.
So the approach of variable resistance to infection seems to “work”, shielding different “layers” from one another (infection-wise). However, how much is quite relative right now, of course. And there are many other considerations to this simplified model (e.g. does the firewall get infected or is it just a vector of transmission? How do we consider a node to recover? can it be infected again after infection)… These and a million other considerations shall come in due time. For instance, other considerations apply to recovery capacity of the nodes, which here we have kept at a fixed 0.5 probability. Recovery in turns will depend on Detection. Post-recovery (“lessons-learnt after incident”) would probably also affect re-infection probability, etc. (so maybe more of a SIRS instead of SIS?)
But for the time being, we have a network with “choke points” that act as segmentation layers that are somewhat effective at preventing an infection (e.g. lateral movement, worm spread…) to jump across network segments; that’s still some progress, in the right direction.
At this point, nothing precludes me now from adapting the MC simulation (for collecting some average numbers over many many simulations) and see if these “more resistant” firewalls affect (hopefully as expected) the statistics compared to using only “normal nodes” with one overall fixed Beta, that is, the results from the other day (Day 4, it was)…
(What I haven’t done yet is clean things up, which will come to bite me soon if I don’t take care of it.)